Learner drivers in Western Australia pass at just 42%, 30 points below Victoria's 72.6%. WA also requires the fewest supervised driving hours of any state. That is not a coincidence.
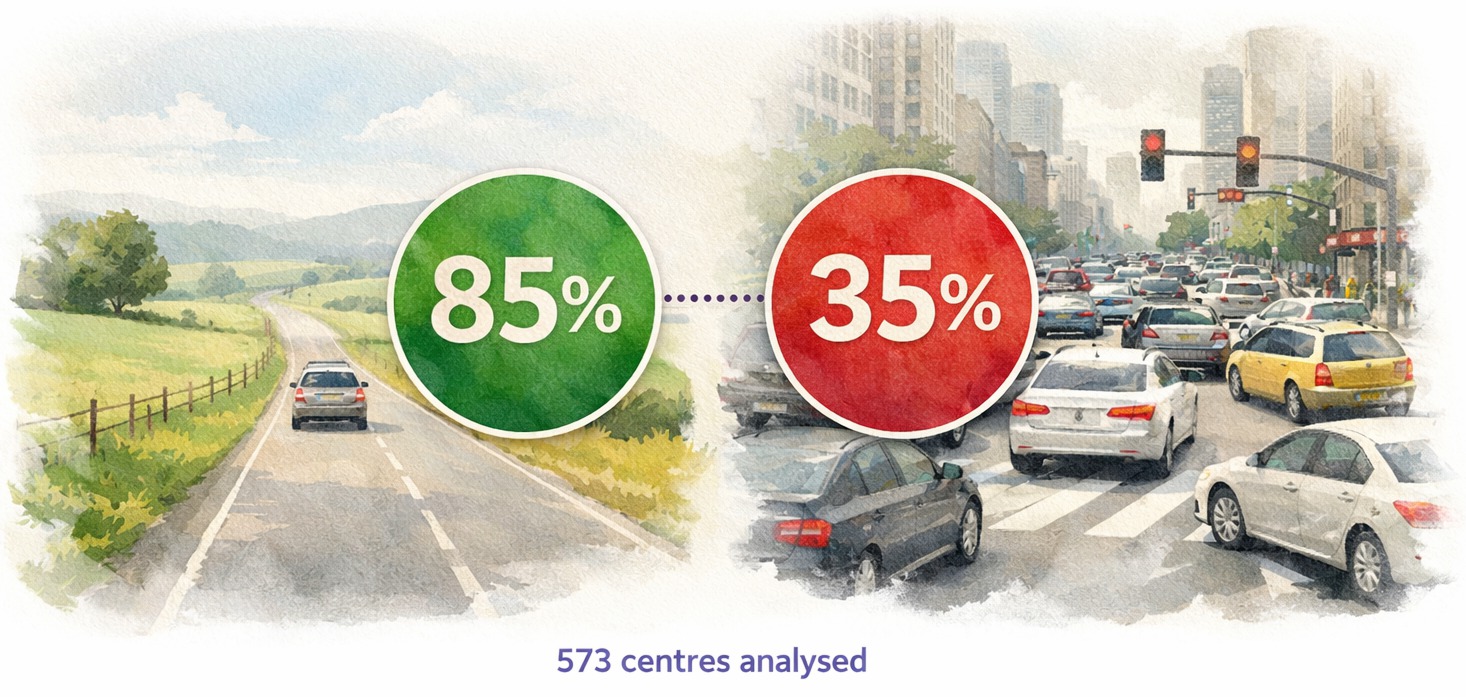
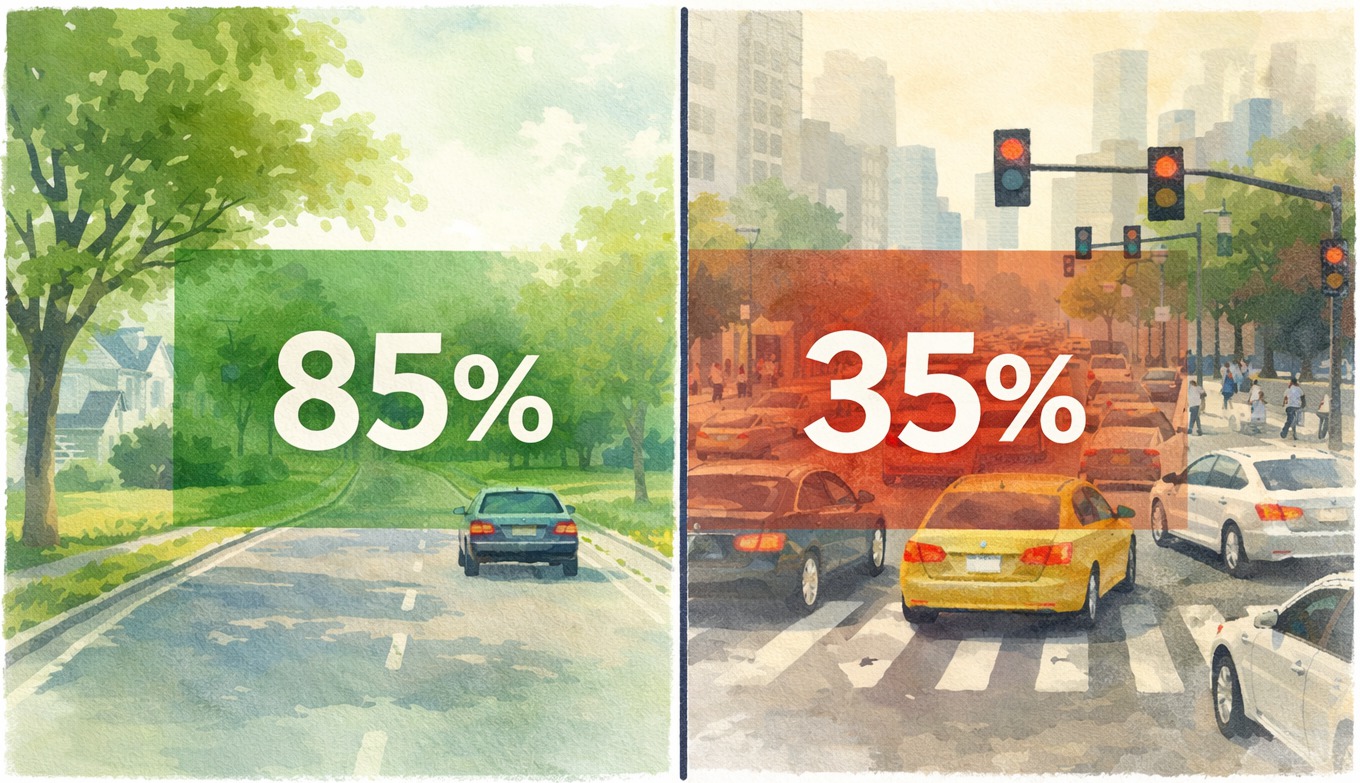
We analysed pass rate data from 573 test centres across Australia, New Zealand, and the United Kingdom. The gap between the easiest and hardest centres is 70 percentage points.
The Policy Question: Do Mandatory Hours Matter?
This is the strongest pattern in the data.
| State | Mandatory Supervised Hours | Pass Rate (avg) | Data Source |
|---|---|---|---|
| VIC | 120 hours | 72.6%* | EzLicence 2023 |
| QLD | 100 hours | 71.1% | QLD Open Data 2024 |
| NSW | 120 hours | 61.7% | TfNSW Open Data 2025 |
| WA | 50 hours | 42.3% | WA DoT FOI 2024-2026 |
*VIC figures are based on EzLicence platform data (~30,000 customer tests), not official government statistics. WA updated to official DoT data (FOI 2026-0140, 292,253 tests). FOI request for VIC pending.
States that require 100-120 supervised hours all sit above 60%. WA, with just 50 hours, sits at 42%. The three other states and territories with published data follow the same pattern: ACT requires no mandatory hours and records a 28% first-attempt pass rate, while TAS and SA (75-80 hours) report pass rates above 80%.
We are not claiming hours cause higher pass rates. VIC's higher rate could reflect test design, demographics, or instructor quality. But 50 hours is an outlier, and so is 35%.
NSW Is Getting Harder
NSW has the most complete dataset: 150 centres with government data covering 1.4 million tests from mid-2022 to early 2026. The statewide trend is downward.
| Year | NSW Overall | Sydney Metro | Regional NSW |
|---|---|---|---|
| 2022 | 54.8% | 51.7% | 59.1% |
| 2023 | 55.7% | 52.5% | 60.2% |
| 2024 | 55.0% | 52.3% | 58.5% |
| 2025 | 54.0% | 51.3% | 57.7% |
| 2026 (Jan-Feb) | 53.0% | 50.1% | 56.8% |
Sydney is now at the edge of a coin flip. The gap between Sydney and regional NSW has stayed steady at 7-8 percentage points throughout.
City vs Country
The urban-rural split is stark across all states.
Sydney's western suburbs, the five hardest centres in NSW:
| Centre | Pass Rate | Tests (LGA total) |
|---|---|---|
| Auburn | 47.0% | Western Sydney |
| Merrylands | 47.0% | Western Sydney |
| Mobile (Lidcombe) | 47.0% | Western Sydney |
| Burwood | 48.6% | Inner West |
| Ryde | 49.3% | Northern Sydney |
Regional NSW, all above 70%:
| Centre | Pass Rate | Area |
|---|---|---|
| Inverell | 85.2% | Northern Tablelands |
| Hay | 78.1% | Riverina |
| Glen Innes | 76.8% | Northern Tablelands |
| Deniliquin | 76.0% | Murray |
| Murwillumbah | 75.2% | Northern Rivers |
Queensland shows the same pattern. Brisbane North averages 50.4% (16,444 tests). Remote Indigenous communities in Cape York and the Torres Strait record 95-100%, though on very small samples (4-50 tests per year). Mid-sized centres tell a clearer story: Bundaberg passes at 76.8% (2,313 tests) versus Moreton Bay at 52.3% (15,264 tests).
Western Australia: Every Centre Below 50%
The official WA state average is 42.3%, based on 292,253 government tests (FOI 2026-0140), up from the earlier EzLicence estimate of 34.8%. All six centres in the EzLicence sample sit below 50%, with Mirrabooka at 30%. Official per-centre data is pending.
WA's Practical Driving Assessment is competency-based and requires only 50 supervised hours, the lowest of any Australian state. NSW and VIC both require 120 hours. Candidates arrive with less practice, and the assessment results reflect that.
New Zealand: Regional Data Only
Waka Kotahi publishes pass rates by region, not by individual centre (2025 Restricted licence data). All centres in the same region share the same rate.
| Region | Pass Rate | Centres |
|---|---|---|
| Taranaki | 77% | 1 |
| Northland | 63% | 2 |
| Waikato | 61% | 4 |
| Bay of Plenty | 59% | 5 |
| Southland | 56% | 1 |
| Manawatu-Whanganui | 55% | 1 |
| Wellington | 53% | 4 |
| Canterbury | 52% | 4 |
| Auckland | 50% | 16 |
| Otago | 45% | 2 |
Auckland, New Zealand's largest city with a third of the national population, records 50%. The pattern holds: urban centres score lower.
United Kingdom: Scotland Outperforms England
The UK dataset is the most complete: 328 DVSA centres with official data from April 2024 to March 2025.
| Nation | Pass Rate (avg) | Centres |
|---|---|---|
| Scotland | 58.1% | 80 |
| Wales | 56.3% | 18 |
| England | 49.7% | 230 |
England's urban centres drag the average down. Wolverhampton records 33.4% (23,438 tests). Featherstone: 34.1%. Chingford in London: 36.5%.
Scotland's rural centres sit at the other extreme. Isle of Skye: 88.2% (17 tests). Ballater: 84.2% (19 tests). Even mid-sized Scottish centres like Arbroath score 78.9% on 247 tests.
Rural centres consistently outperform urban centres across Australia, NZ, and the UK. Source: AUDrive analysis of government open data.
The Pattern
Across all three countries, rural and remote centres outperform cities.
| Country | Easiest | Hardest | Gap |
|---|---|---|---|
| Australia | Inverell, NSW: 85% | Mirrabooka, WA: 30% | 55 pts |
| UK | Isle of Skye: 88% | Wolverhampton: 33% | 55 pts |
| NZ | Taranaki region: 77% | Otago region: 45% | 32 pts |
Three factors likely contribute: lower traffic volumes, simpler road layouts, and more on-road experience among rural candidates before they sit the test. None of this means rural tests are inherently easier. But a learner who has driven farm roads for a year is better prepared than one who has only practised in a car park.
Methodology
This analysis covers 573 test centres with publicly available pass rate data:
| Country | Centres | Source | Period |
|---|---|---|---|
| Australia (NSW) | 150 | TfNSW Open Data | Jul 2022 - Feb 2026 |
| Australia (QLD) | 39 | data.qld.gov.au | 2023 |
| Australia (VIC) | 10 | EzLicence platform data | 2022-2023 |
| Australia (WA) | statewide | WA Dept of Transport (FOI 2026-0140) | Jan 2024 - Apr 2026 |
| New Zealand | 40 | Waka Kotahi Open Data | 2025 |
| United Kingdom | 328 | DVSA official statistics | Apr 2024 - Mar 2025 |
Important caveats:
- VIC data comes from EzLicence, a driving test booking platform (~30,000 customer tests), not official government statistics. A FOI request for official VIC data is pending.
- WA state average is official government data (DoT FOI 2026-0140, 292,253 tests). Individual WA centre pass rates cited in this article still use EzLicence estimates pending official per-centre release.
- NZ data is aggregated by region, not individual centre.
- QLD data includes very small centres (under 50 tests/year) where pass rates can be extreme and unrepresentative.
- ACT, SA, TAS, and NT do not publish centre-level data. State-level figures cited above come from government reports and industry surveys.
- Data periods range from 2022 to 2026 across sources. Cross-state comparisons should be interpreted with this in mind.
Interactive data: Explore pass rates for all 573 centres at audrive.net/en/au/pass-rates, audrive.net/en/nz/pass-rates, and audrive.net/en/uk/pass-rates.
Media contact: [email protected]
AUDrive maps GPS driving test routes for 659 centres across Australia, New Zealand, and the UK.