
Seven people over 100 years old sat the WA driving test. Five passed.
That is one of the stranger findings from the 292,253 Class C driving tests the WA Department of Transport released to us under Freedom of Information. The dataset covers every Practical Driving Assessment in Western Australia from January 2024 to April 2026, broken down by age, gender, transmission, overseas status, attempt number, and quarter.
The headline number: 42.3% pass. But the averages hide a lot. A 90-year-old retiree passes more often than a 30-year-old professional. A woman in a manual car beats a man in an automatic. And the hardest test centre in Australia is not in Sydney or Melbourne. It is in Perth's eastern suburbs.
The Real Number: 42.3%, Not 34.8%
Until now, the only WA-specific pass rate came from a third-party driving test booking platform that reported 34.8% based on roughly 30,000 customer tests in 2022-2023.
The official data says 42.3%. That is 7.5 points higher.
The likely explanation: the platform's customer base skews toward first-time candidates who book online. The government data includes everyone, including re-testers and overseas licence holders who tend to have higher pass rates on subsequent attempts.
WA is still the lowest of any Australian state with published data:
| State | Pass Rate | Mandatory Hours | Source |
|---|---|---|---|
| VIC | 72.6%* | 120 hours | Third-party platform 2023 |
| QLD | 71.1% | 100 hours | QLD Open Data 2024 |
| NSW | 61.7% | 120 hours | TfNSW Open Data 2025 |
| WA | 42.3% | 50 hours | WA DoT FOI 2024-2026 |
*VIC figure is from third-party platform data, not official government statistics.
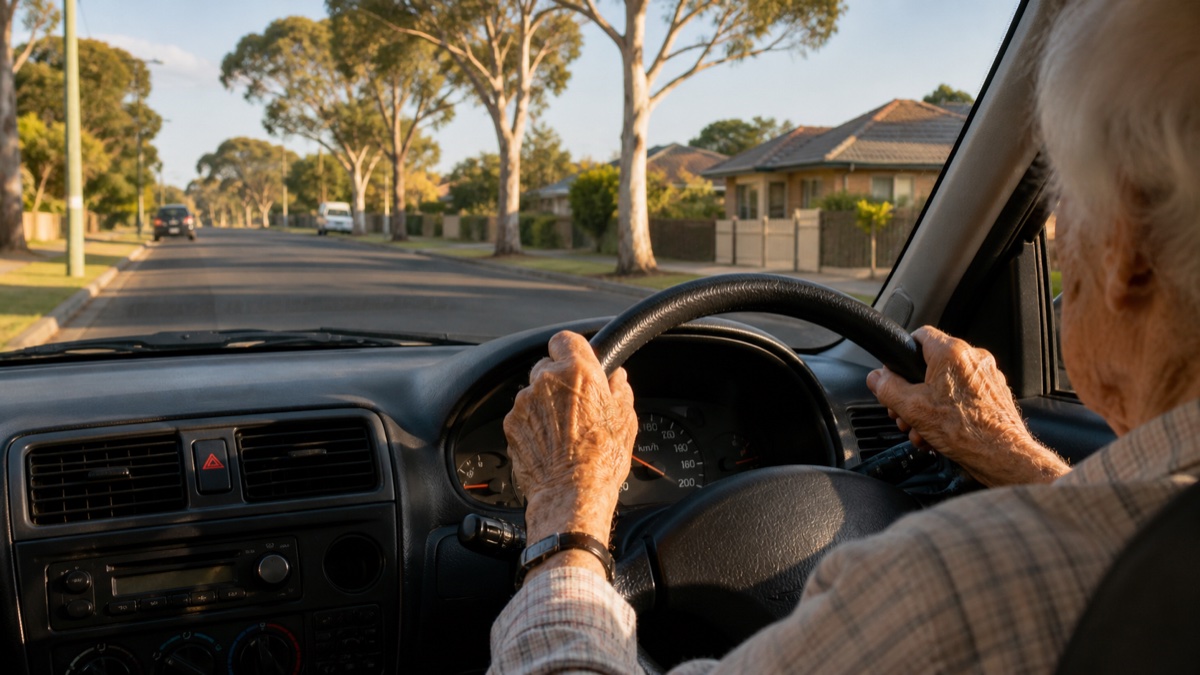
WA drivers aged 80-89 pass at 52.9%, higher than the state average. Many are experienced locals re-testing to keep their licence.
The U-Shaped Age Curve
This is the most surprising pattern in the data.
You would expect younger candidates to do best and older ones to do worst. That is true up to a point. But then the curve reverses.
| Age Group | Pass Rate | Tests | What They Are |
|---|---|---|---|
| 15-19 | 46.7% | 140,827 | Learner drivers, first licence |
| 20-29 | 40.7% | 72,413 | Mix of late learners and overseas conversions |
| 30-39 | 36.7% | 51,648 | Mostly overseas conversions |
| 40-49 | 34.2% | 18,790 | Overseas conversions, career changers |
| 50-59 | 31.2% | 4,682 | Overseas conversions, relicensing |
| 60-69 | 29.8% | 1,421 | The bottom. Conversions and lapsed licences |
| 70-79 | 34.4% | 604 | Starting to rise again |
| 80-89 | 52.9% | 1,481 | Higher than the state average |
| 90-99 | 57.9% | 380 | Higher than every group under 20 except teens |
| 100+ | 71.4% | 7 | Five out of seven passed |
Why do people over 80 outperform people in their 30s?
WA requires drivers aged 85 and over to pass a practical assessment to keep their licence. These are experienced local drivers who have been on WA roads for decades. They know the test routes, they know the rules, and they have done this before. 92% of the 80-89 group are "not novice" locals, not overseas converters.
Compare that to the 30-39 age group: heavily weighted toward overseas licence conversions, unfamiliar with WA roads, and often dealing with left-hand driving for the first time. The 80-year-olds are not better drivers. They are better prepared for this specific test.
The seven centenarians are the extreme version of this. All local, all re-testing. Five drove automatics and passed. Two tried manuals. Both failed.
The 7.8% Catastrophe: Experienced Overseas Drivers
This is the single lowest pass rate of any group in the entire dataset.
The FOI data splits candidates along two dimensions: "Novice" (currently a learner) vs "Not Novice" (holds or held a full licence), and "Overseas" vs "Local". Cross them:
| Category | Pass Rate | Tests | Who They Are |
|---|---|---|---|
| Novice + Local | 44.3% | 193,215 | Standard WA learner drivers |
| Novice + Overseas | 41.9% | 72,514 | Overseas residents learning in WA |
| Not Novice + Local | 59.0% | 11,298 | WA licence holders re-testing (incl. 85+ renewals) |
| Not Novice + Overseas | 7.8% | 15,226 | Experienced overseas drivers converting |
15,226 tests. 7.8% pass rate. That is roughly 1 in 13.
These are people who already hold a full overseas licence and are trying to convert it to a WA licence. They have driving experience, probably years of it. And they fail at nearly 13 times the rate of local re-testers doing the same assessment.
Why? They arrive expecting a formality and get a 45-minute assessment on unfamiliar roads with unfamiliar rules. Left-side driving, Australian roundabout give-way rules, school zone speed limits, bus give-way laws. They have never practised on WA test routes.
The learners (Novice + Overseas) at 41.9% do massively better because they go through the WA learner system: supervised hours, professional lessons, practice on local roads. The "experienced" overseas drivers skip all of that.
Manual Beats Automatic (and Women Beat Men in Manual)
Candidates who test in a manual car pass at 47.0%. Automatic: 40.6%.
That is counterintuitive. Manual is harder to drive. But both follow the same PDA assessment. The gap is about who chooses manual: candidates with more hours, more confidence, and usually a specific reason (military, trade, farm).
When you cross transmission with gender, an interesting pattern emerges:
| Combination | Pass Rate | Tests |
|---|---|---|
| Female + Manual | 48.2% | 21,386 |
| Male + Manual | 46.6% | 58,761 |
| Female + Automatic | 41.0% | 108,318 |
| Male + Automatic | 40.1% | 103,701 |
Women who choose manual have the highest pass rate of any gender-transmission group. They outperform men in automatics by 8.1 points.
The gender gap overall is almost zero (Male 42.4% vs Female 42.2%), but the transmission choice flips the picture entirely. The lesson: it is not what you drive, it is how prepared you are when you drive it.
Where the Gender Gap Actually Appears
Among young candidates, men and women perform almost identically. Among older candidates, a gap opens up.
| Age | Female | Male | Gap |
|---|---|---|---|
| 15-19 | 47.4% | 46.1% | F +1.3 |
| 20-29 | 40.8% | 40.6% | F +0.2 |
| 30-39 | 35.3% | 37.9% | M +2.6 |
| 40-49 | 31.7% | 36.3% | M +4.6 |
| 50-59 | 27.4% | 35.3% | M +7.9 |
| 60-69 | 25.6% | 33.0% | M +7.4 |
At 15-19, women slightly outperform men. By 50-59, the gap is nearly 8 points in the other direction.
This is likely a composition effect rather than a skills gap. In the older age brackets, a larger share of female candidates are overseas licence converters who may have less recent on-road experience, particularly from countries where women drive less frequently.
63% Need More Than One Attempt
Only 37% of all people who eventually pass do so on their first attempt. The rest need two, three, or more tries.
| Attempt | Passes | Share of All Passes |
|---|---|---|
| 1st attempt | 45,842 | 37.0% |
| 2nd attempt | 32,546 | 26.3% |
| 3rd attempt | 19,134 | 15.5% |
| 4th+ attempt | 26,230 | 21.2% |
The age breakdown tells a sharper story. Teenagers are much more likely to pass first time (42.6%), while the 40-49 group has the lowest first-attempt rate (28.6%) and the highest 4+ attempt rate (31.2%).
| Age | 1st Attempt % | 4+ Attempt % |
|---|---|---|
| 15-19 | 42.6% | 15.2% |
| 20-29 | 29.5% | 28.7% |
| 30-39 | 31.7% | 26.7% |
| 40-49 | 28.6% | 31.2% |
| 50-59 | 31.8% | 32.1% |
Nearly a third of candidates in their 40s who eventually pass needed four or more attempts. That is persistence.
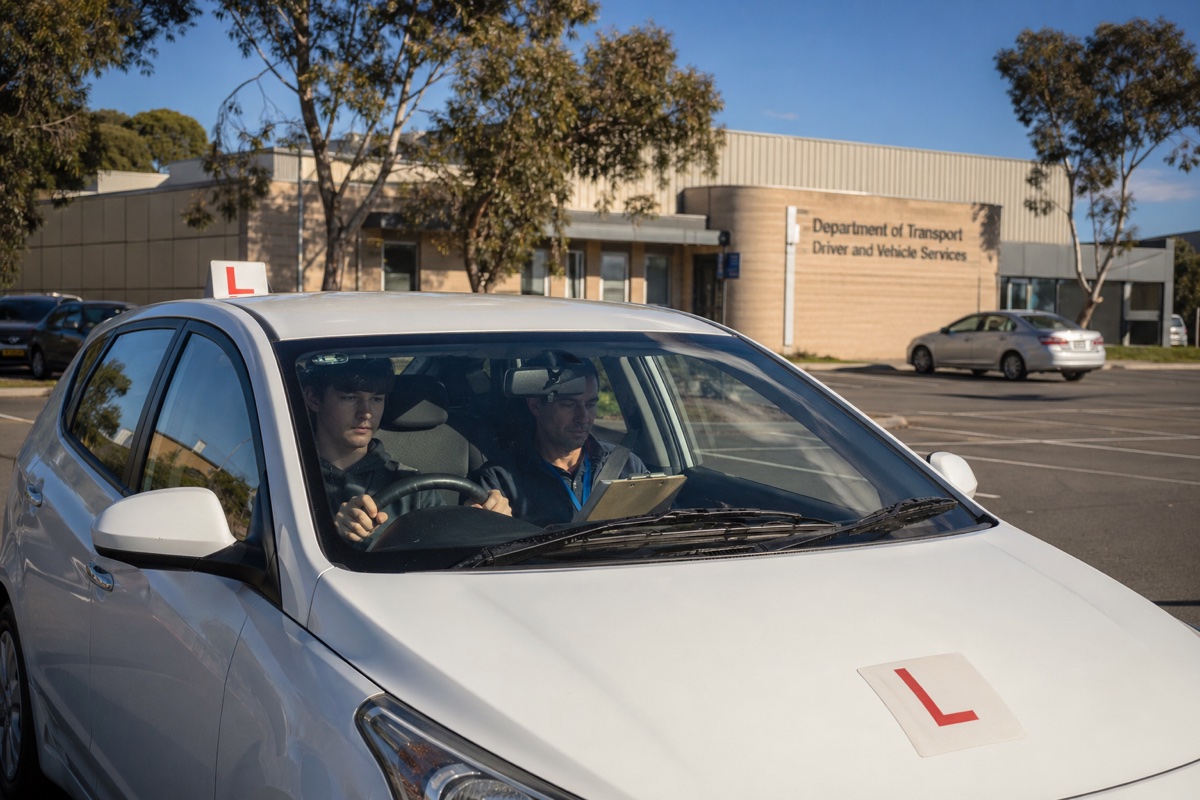
A typical WA driving test centre. The same PDA assessment applies everywhere, but pass rates vary by 28 points across Perth.
Centre-by-Centre: Where You Test Matters
A separate FOI release provides monthly pass/fail data for 25 individual DVS centres across WA, covering 244,557 tests from January 2024 to March 2026. This is a subset of the aggregate 292,253-test dataset, which extends to April 2026 and includes tests not assigned to a specific centre.
Perth Metro
| Centre | Pass Rate | Tests | 2024 → 2025 |
|---|---|---|---|
| Cannington | 56.4% | 12,766 | 60.8% → 55.1% (↓5.7) |
| Mandurah | 43.1% | 10,686 | 41.3% → 44.3% (↑3.0) |
| Joondalup | 42.8% | 52,901 | 44.8% → 40.9% (↓3.9) |
| Butler | 41.6% | 14,434 | 38.4% → 44.6% (↑6.2) |
| Kelmscott | 39.3% | 44,087 | 42.9% → 36.3% (↓6.5) |
| Rockingham | 38.3% | 21,421 | 38.9% → 37.7% (↓1.2) |
| City West Perth | 34.1% | 18,878 | 35.5% → 32.9% (↓2.6) |
| Mirrabooka | 31.3% | 19,563 | 28.1% → 34.2% (↑6.0) |
| Midland | 28.3% | 20,326 | 29.3% → 27.5% (↓1.8) |
Midland (28.3%) is the hardest major test centre in Australia. Fewer than 3 in 10 pass. Cannington (56.4%) is the best in Perth, but it is on a steep decline: 60.8% in 2024, 55.1% in 2025, 49.2% in Q1 2026.
Two centres bucked the downward trend: Butler (+6.2 points) and Mirrabooka (+6.0 points) both improved from 2024 to 2025. Kelmscott had the steepest fall at 6.5 points.
Metro vs Regional
| Area | Pass Rate | Tests |
|---|---|---|
| Metro (9 centres) | 39.2% | 215,062 |
| Regional (13 centres) | 53.6% | 26,332 |
A 14.4-point gap. Exmouth (79.3%), Carnarvon (73.7%), and Kununurra (73.6%) all pass at rates comparable to Victoria. Bunbury (36.4%) is the only regional centre that performs at metro levels.
Same test, same PDA criteria. The difference is likely candidate composition: regional WA residents start driving earlier and accumulate more hours out of necessity.
Explore all centre pass rates on our interactive pass rate rankings, or see the Perth Test Centre Comparison for tips on choosing a location.
The Quarterly Trend
| Quarter | Pass Rate | Tests |
|---|---|---|
| 2024 Q1 | 44.1% | 30,989 |
| 2024 Q2 | 43.4% | 30,545 |
| 2024 Q3 | 43.9% | 32,302 |
| 2024 Q4 | 41.9% | 30,972 |
| 2025 Q1 | 40.6% | 30,188 |
| 2025 Q2 | 41.9% | 32,228 |
| 2025 Q3 | 41.3% | 35,645 |
| 2025 Q4 | 41.3% | 33,784 |
| 2026 Q1 | 42.3% | 30,951 |
The pass rate dropped 3.5 points from 2024 Q1 (44.1%) to 2025 Q1 (40.6%), then stabilised. 2026 Q1 shows a slight uptick back to 42.3%. Whether this is a real reversal or noise is too early to say.
This mirrors NSW, where Sydney's pass rate fell from 52.5% in 2023 to 50.1% in early 2026. Driving tests in Australia are getting harder. Not easier.
What This Means for You
Five things from 292,000 tests:
1. Drive well beyond 50 hours. States with 100-120 mandatory hours all pass above 60%. WA requires 50 and gets 42%. Aim for 80-100 hours.
2. If converting an overseas licence, do not wing it. 7.8% pass rate for experienced overseas drivers. Book 5-10 hours with a local instructor. It is not about your driving ability. It is about knowing WA roads and rules.
3. Choose your transmission carefully. Manual gives a 6.4-point statistical edge and a licence that covers both types. But only if you are genuinely comfortable with it.
4. Pick Cannington over Midland. A 28-point gap between Perth's best and worst centre is not luck. Compare all centres here.
5. Failing is normal. 63% of people who eventually pass needed more than one attempt. In the 40-49 age group, nearly a third needed four or more tries.
Methodology
This analysis uses data released by the WA Department of Transport under the Freedom of Information Act 1992 (WA), reference FOI 2026-0140, across two releases:
| Detail | Aggregate Dataset | Per-Centre Dataset |
|---|---|---|
| Period | Jan 2024 to Apr 2026 | Jan 2024 to Mar 2026 |
| Total tests | 292,253 | 244,557 |
| Dimensions | Novice, Overseas, Transmission, Gender, Age, Quarter, Attempt | Centre, Month, Pass/Fail |
| Centres | Not broken down | 25 DVS centres |
The difference in test counts (47,696) reflects the shorter date range in the per-centre release and tests not assigned to a named centre.
Comparison with previous estimates: The 34.8% figure previously cited came from a third-party platform (approximately 30,000 customer tests, 2022-2023). The official data covers nearly 10x more tests and returns a materially higher pass rate.
Interactive data: Explore pass rates for all Australian centres at audrive.net/en/au/pass-rates.
Media enquiries: [email protected]. Raw data available on request.
Frequently Asked Questions
What is the official WA driving test pass rate?
42.3%, based on 292,253 Class C tests from January 2024 to April 2026. Higher than the 34.8% previously estimated from third-party data, but still the lowest of any Australian state with published figures.
Why do people over 80 have a higher pass rate than people in their 30s?
WA requires drivers aged 85+ to pass a practical assessment to keep their licence. These are experienced locals who know WA roads and test routes. The 30-39 age group is heavily weighted toward overseas licence conversions. The 80-89 group passes at 52.9%. The 30-39 group passes at 36.7%.
What is the pass rate for overseas licence conversions?
It depends on whether you go through the learner system. Overseas candidates who complete WA's learner pathway pass at 41.9%. Experienced overseas drivers trying to convert directly pass at just 7.8%, the lowest of any group.
Do you have a better chance in a manual or automatic?
Manual candidates pass at 47.0% vs 40.6% for automatic. The gap is not about the test being easier. Manual candidates tend to be more experienced. Women in manual cars (48.2%) outperform men in automatics (40.1%).
Is the WA driving test getting harder?
The pass rate dropped from 44.1% in Q1 2024 to 40.6% in Q1 2025, then stabilised. Q1 2026 shows a slight uptick to 42.3%. The overall trend is downward, consistent with what NSW data shows.
Which test centre has the highest pass rate?
In Perth metro: Cannington at 56.4%, but declining (was 60.8% in 2024). In regional WA: Exmouth at 79.3%. Midland (28.3%) is the hardest major centre in Australia. See our Perth Test Centre Comparison for the full breakdown.
How many attempts does it take to pass?
63% of candidates who eventually pass need more than one attempt. Only 37% pass on their first try. In the 40-49 age group, 31.2% needed four or more attempts.
Data source: Western Australian Department of Transport, FOI 2026-0140. 292,253 Class C PDA results (aggregate) and 244,557 per-centre results.
AUDrive maps GPS driving test routes for 690+ centres across Australia, New Zealand, and the UK.